
Overview of Vietnam’s exports of agricultural and food products to the EU in the period 2018-2022
21/12/2023 278320. Overview of Vietnam’s exports of agricultural and food products to the EU in the period 2018-2022
The EU until now has not yet been the big market for Vietnam’s exports of agricultural and food products, however, it is a considerable potential market, especially in the segment of high-value and organic products in the context that Vietnam’s exports of agricultural and food products have tariff advantages in EU-Vietnam Free Trade Agreement (EVFTA).
For turnover, Vietnam’s export of agricultural and food products to the EU in general has a considerable growth over 5 recent years, increasing from USD 4.09 billion in 2018 to USD 5.27 billion in 2022 (ITC Trade Map). The average export growth rate of agricultural and food products from Vietnam to the EU for the period of 2018-2022 reached 5.9%, much better than that of the world (2.6%).
Room for increasing exporting these goods is big when exporting agricultural and food products from Vietnam to the EU only accounts for a small portion, about 0.8% of EU’s total imports of related products.
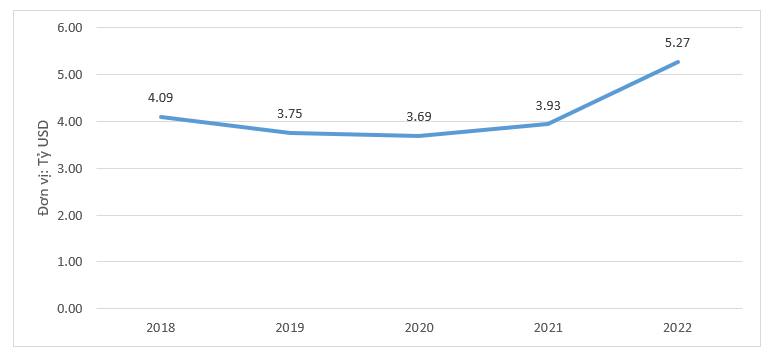
Source: Summary of VCCI Research Group from ITC Trade Map, 2023
For products, Vietnam’s key agricultural and food products exporting to the EU are tea, coffee, spices, fresh/processed fruit; seafood, cereals and cereal products, etc, of which, coffee, tea, spices are the product group of highest exporting values to the EU and have considerable market share in EU’s import market (accounting for 7.4%, standing at 2nd position among the market exporting the most coffee, to the EU market, only after Brazil). Next are nuts, seafood. All these 3 leading groups are also products facing many new green policies in the European Green Deal.
Table 1 - Group of agricultural and food products imported by the EU from Vietnam in 2022
|
Products |
Export turnover (USD million) |
Top 5 countries (outside EU) from which EU imports the most of these products |
|
Chapter 09: Coffee, tea, Paraguay tea and spices |
1,966.47 |
Brazil, Vietnam, Honduras, Colombia, Peru |
|
Chapter 8: Edible fruit and nuts; peel of citrus fruit or melons |
915.93 |
US, Peru, South Africa, Turkey, Costa Rica |
|
Chapter 3: Fish and crustaceans, molluscs and other aquatic invertebrates |
902.11 |
China, UK, India, Ecuador, Morrocco, Vietnam (8) |
|
Chapter 16: Preparations of meat, of fish or of crustaceans, molluscs or other aquatic invertebrates |
505.53 |
Ecuador, Thailand, Vietnam, China, Morrocco |
|
Chapter 19: Preparations of cereals, flour, starch or milk; pastrycooks' products |
234.38 |
UK, Switzerland, China, Thailand, Greece |
|
Chapter 20: Preparations of vegetables, fruit, nuts or other parts of plants |
122.00 |
Brazil, Turkey, China, Greece, UL |
|
Chapter 10: Cereals |
92.95 |
Ukraine, Brazil, Canada, UK, US |
|
Chapter 15: Animal or vegetable fats and oils and their cleavage products; prepared edible fats; animal or vegetable waxes. |
76.93 |
Indonesia, Ukraine, Malaysia, China, the Philippines |
|
Chapter 05: Products of animal origin, not elsewhere specified or included |
31.55 |
China, UK, Brazil, US, Iran |
Source: Summary of VCCI Research Group from ITC Trademap, 2023
For export markets, Germany is Vietnam’s biggest export market in EU of 3 goods products coffee, spices; fruits/nuts and seafood, respectively accounting for 33.3%, 34.4% and 18.7% of total exports of related goods from Vietnam to the EU market in 2022. Besides Germany, some other EU countries such as Italy, the Netherlands, Spain, Belgium, etc. also have the enormous demand for Vietnam’s agricultural and food products. These are also the markets where customers have high demand for green, organic products.
Table 2- Exports of coffee, tea, spices (HS 09) from Vietnam to some EU countries in 2022
|
Market |
Export turnover (USD million) |
Proportion rate |
|
Germany |
655.631 |
33.3% |
|
Italy |
406.275 |
20.7% |
|
Spain |
284.643 |
14.5% |
|
Belgium |
177.229 |
9.0% |
|
Netherlands |
81.021 |
4.1% |
Source: Summary of VCCI Research Group from ITC Trademap, 2023
Table 3 - Exports of fruit, nut (HS 08) from Vietnam to some EU countries in 2022
|
Market |
Export turnover (USD million) |
Proportion rate |
|
Germany |
314.645 |
34.4% |
|
Netherlands |
235.444 |
25.7% |
|
France |
104.295 |
11.4% |
|
Spain |
61.951 |
6.8% |
|
Italy |
41.369 |
4.5% |
Source: Collection of VCCI Research Group from ITC Trademap, 2023
Table 4 - Exports of seafood (HS 03) from Vietnam to some EU countries in 2022
|
Market |
Export turnover (USD million) |
Proportion rate |
|
Germany |
168.435 |
18.7% |
|
Belgium |
138.227 |
15.3% |
|
Netherlands |
131.750 |
14.6% |
|
France |
111.306 |
12.3% |
|
Italy |
79.009 |
8.8% |
Source: Summary of VCCI Research Group from ITC Trademap, 2023
Source: Report "EU Green Deal and Vietnam's Exports - The case of the agricultural, food and textile industries" – Center for WTO and International Trade
- Grasping the green transformation trend - A survival opportunity for Vietnamese Enterprises
- Ways of European Green Deal’s impacts on Vietnam’s exports
- EU Green Deal and Vietnam's export: Impacted sectors
- EU Green Deal and Vietnam's export: Challenges of awareness change and enhancement
- EU Green Deal and Vietnam's export: Challenge in capability of response, compliance