
Open Trade Statistics - World trade data visualization tool
03/07/2023 24461. Introduction about Open Trade Statistics (https://shiny.tradestatistics.io/countryprofiles/?_inputs_&y=%5B2010%2C2020%5D&d=%22No%22&p=%22all%22&r=%22vnm%22&go=4)
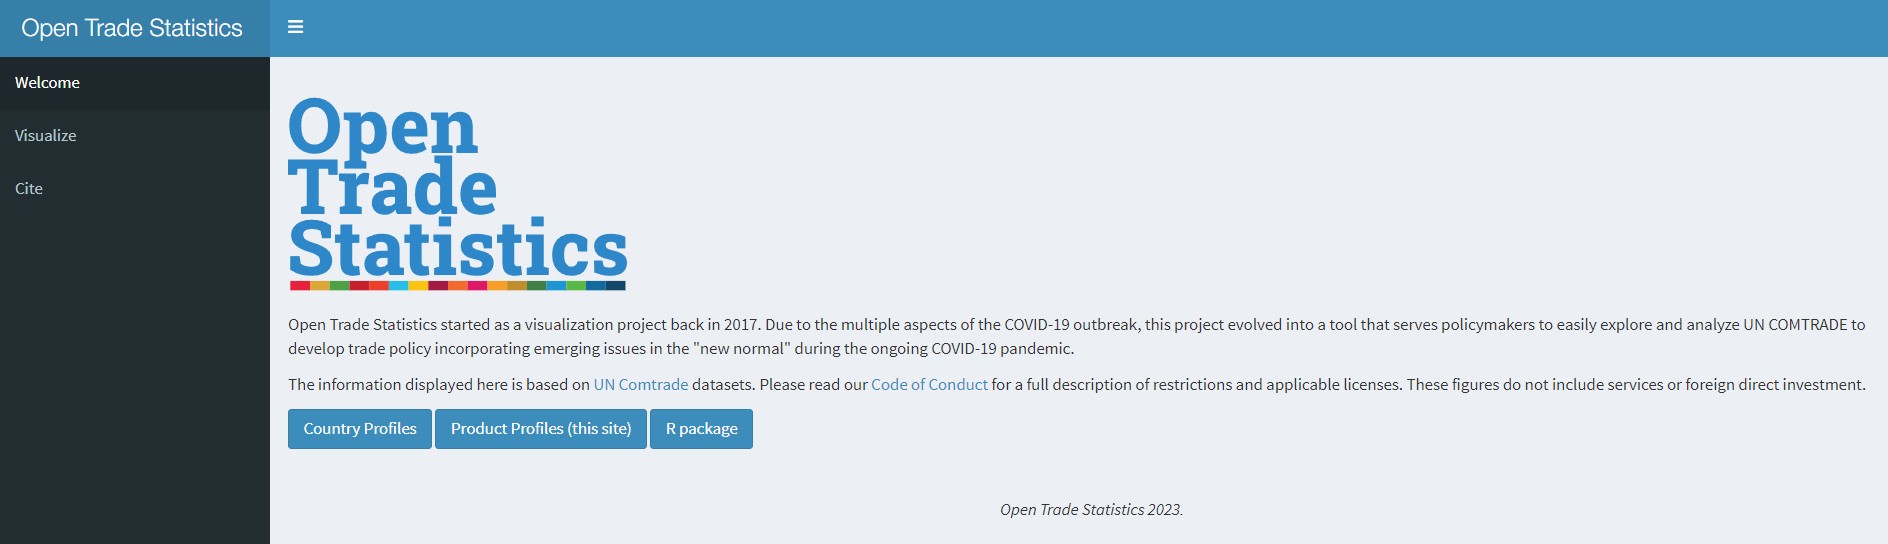
Open Trade Statistics started as a visualization project back in 2017. Due to the multiple aspects of the COVID-19 outbreak, this project evolved into a tool that serves policymakers to easily explore and analyze UN COMTRADE (The United Nations database compiles annual and monthly global trade statistics by product and trading partner - details are available at https://comtradeplus.un.org/) to develop trade policy incorporating emerging issues in the "new normal" during the ongoing COVID-19 pandemic.
2. Open Trade Statistics User Guide
Open Trade Statistics includes 02 main categories. The following section will briefly introduce the content of each category so that users have an overview of the information that can be searched on this online tool.
Introduction to the content and how to use the categories of Open Trade Statistics
|
No. |
Section | Content | Information availble |
| 1 | Country Profiles | Provides visual information about the trade situation between a United Nations member country and a trading partner of that country over a certain period of time. |
- Export and import turnover of a United Nations member country - Proportion of main import and export products between the two countries - Import and export value of key products between the two countries (in the form of a downloadable table) |
| 2 | Products Profiles | Provides visual information about the trade situation of a product (classified by HS code) in the world in a certain period of time. |
- Compare the world import and export value of a product over the years - The largest exporting and importing country in the world of a product type - Proportion of import and export of a product of each country - Import and export value of a product between countries over the years (in the form of a downloadable table) |
Example 1: Look up information about the trade situation between two countries
Step 1: Click on the Visualize item in the Menu, the page will redirect to the visualization tool.
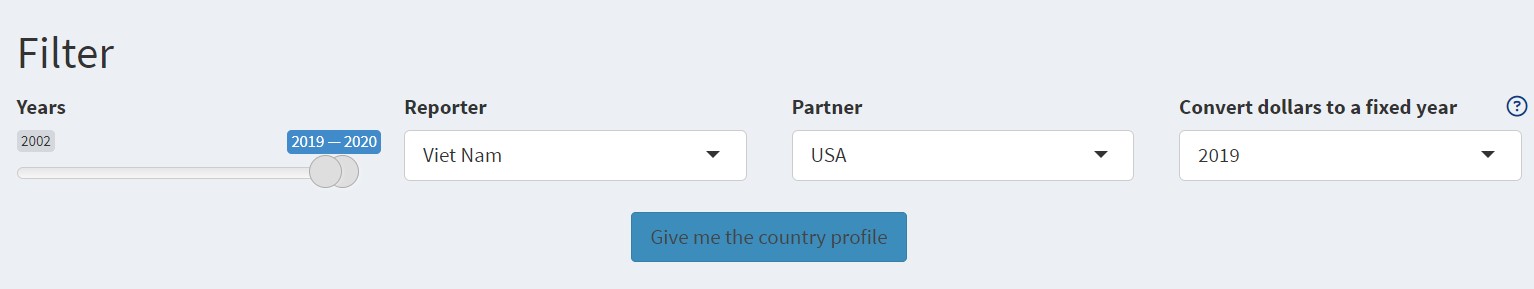
Step 2: Select the time period, the member country (the country you want to see the data), the trading partner country and the dollar rate in the corresponding year (optional). Then select Give me the country profile and the page will display the corresponding results.
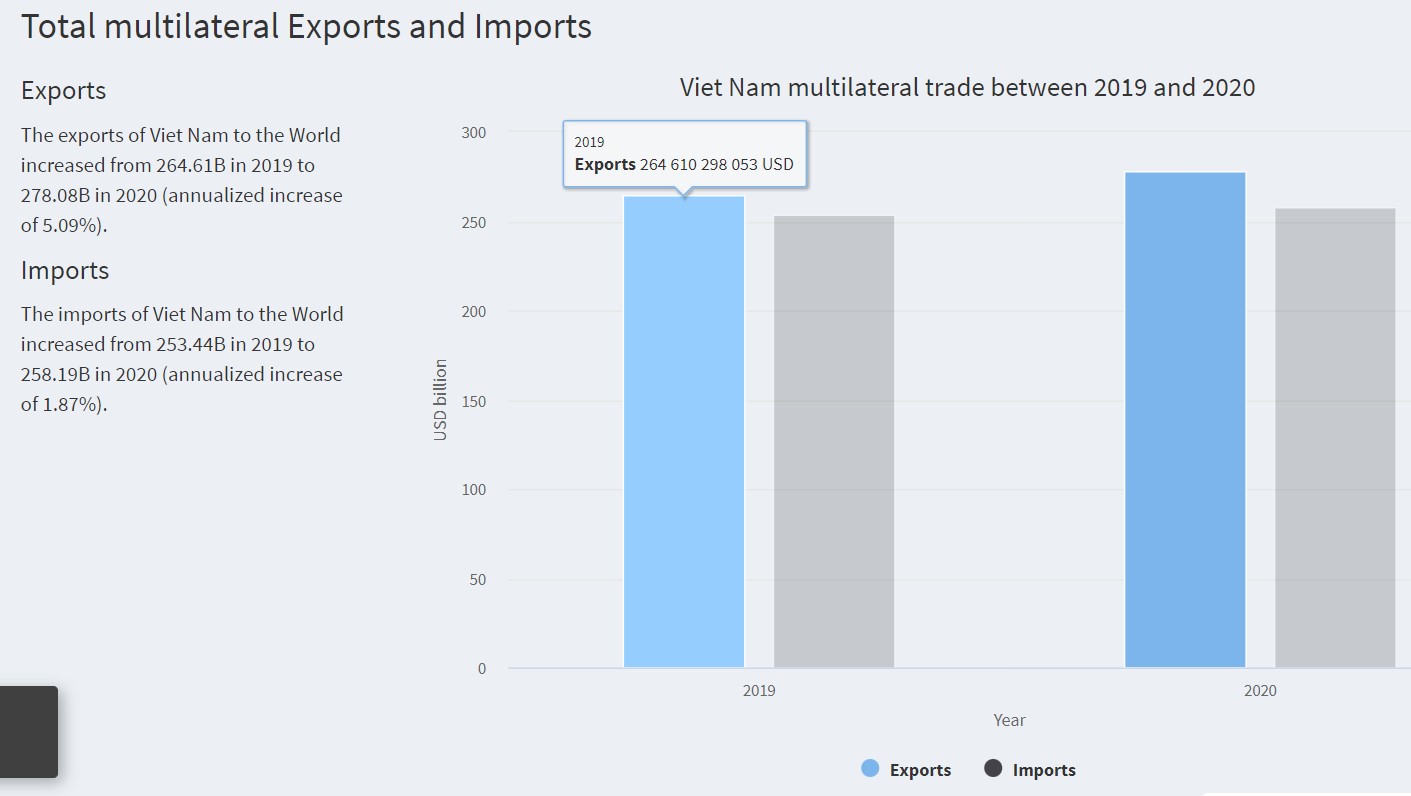
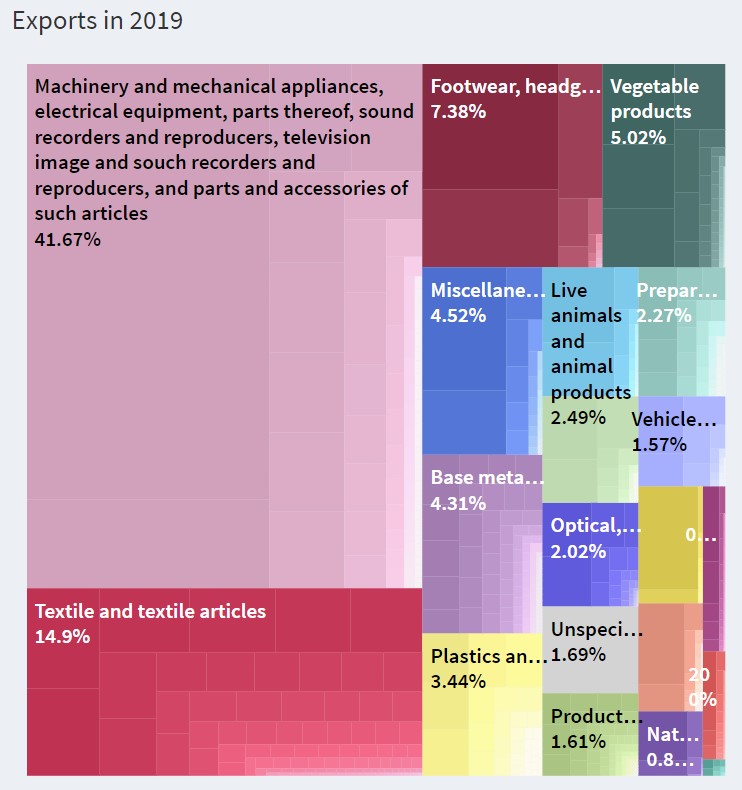
Step 3: Read the result. You can hover or click on the charts to see more detailed information.
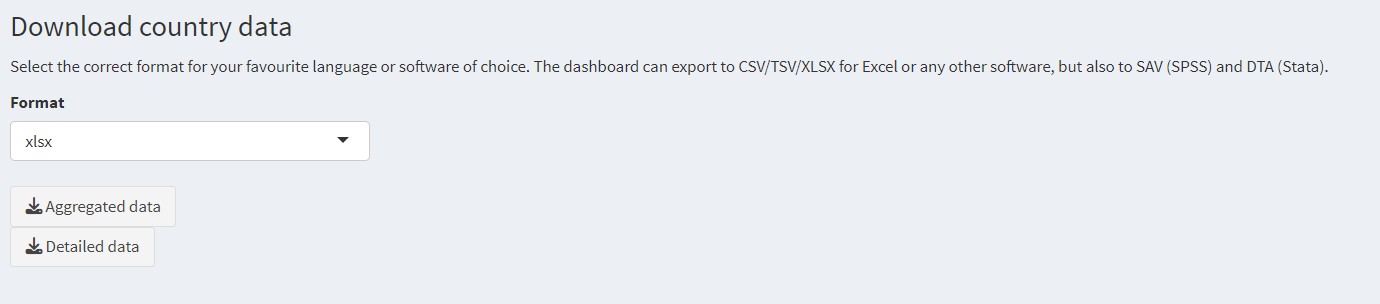
You can download detailed data (in csv, tsv, xlsx, sav, dta format) on the trade situation of the two countries in Aggregated data version or Detailed data version.
Example 2: Look up information about the trade situation of a product in the world
Step 1: Click on the Produts Profiles section, the page will redirect to the Products Profiles section.
Step 2: Click on the Visualize item in the Menu, the page will redirect to the visualization tool.
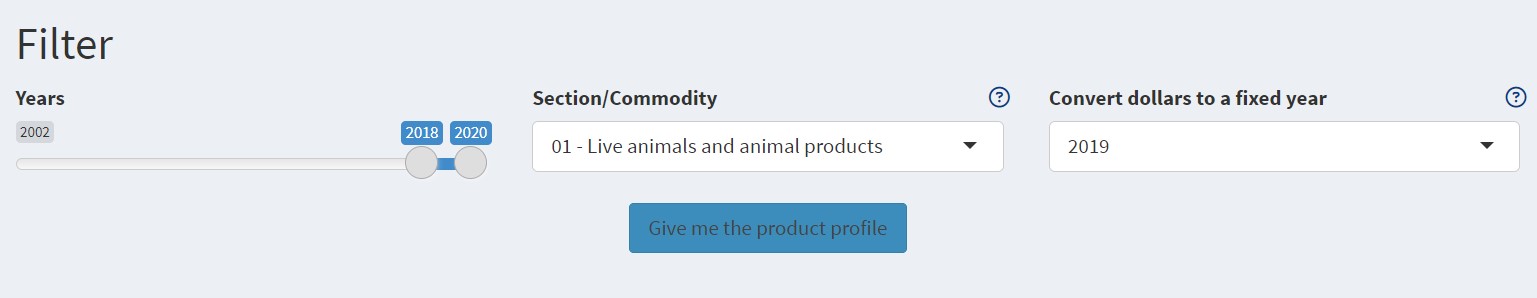
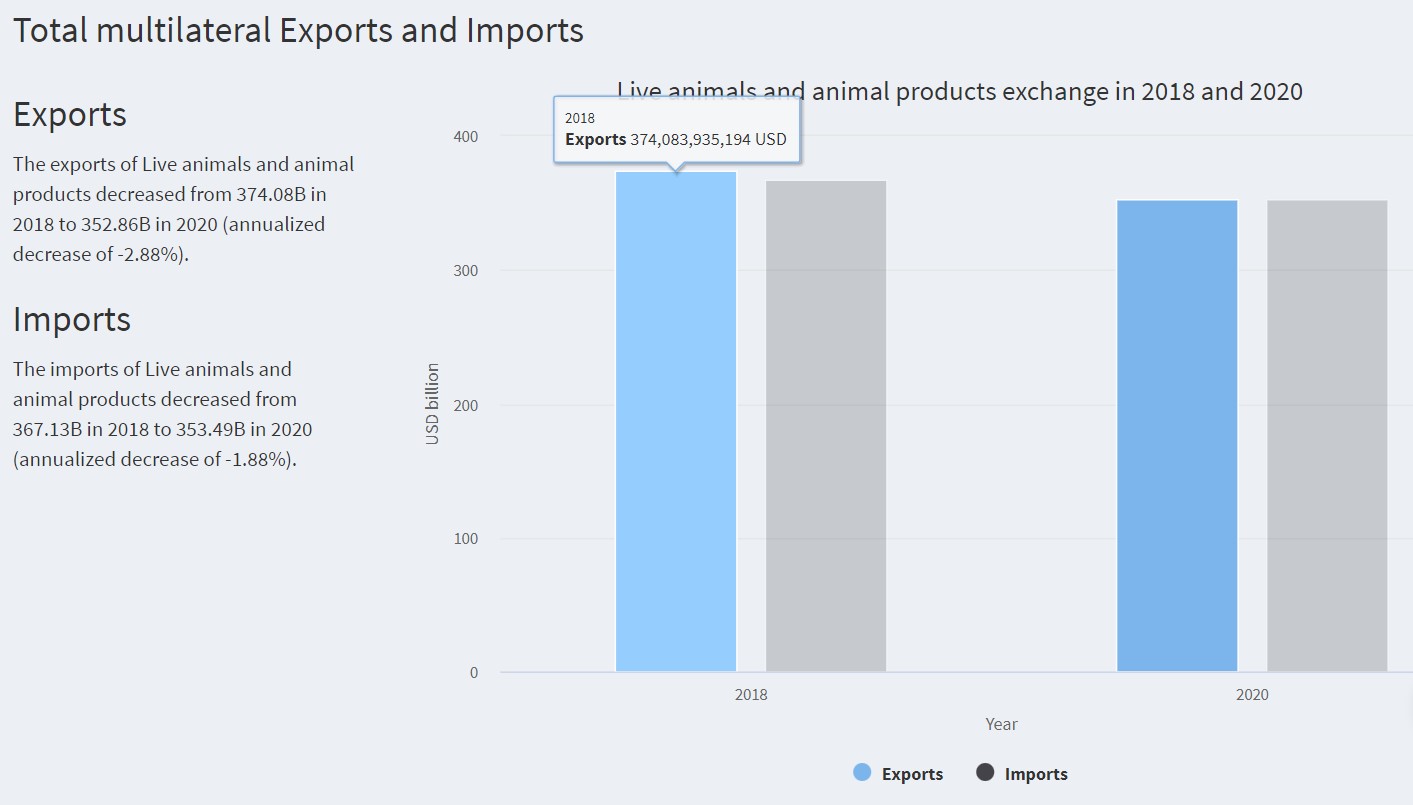
Step 3: Select the time period and product group you want to look up; select the dollar rate in the respective year (Optional). Then select Give me the product profile, the page will display the corresponding results.
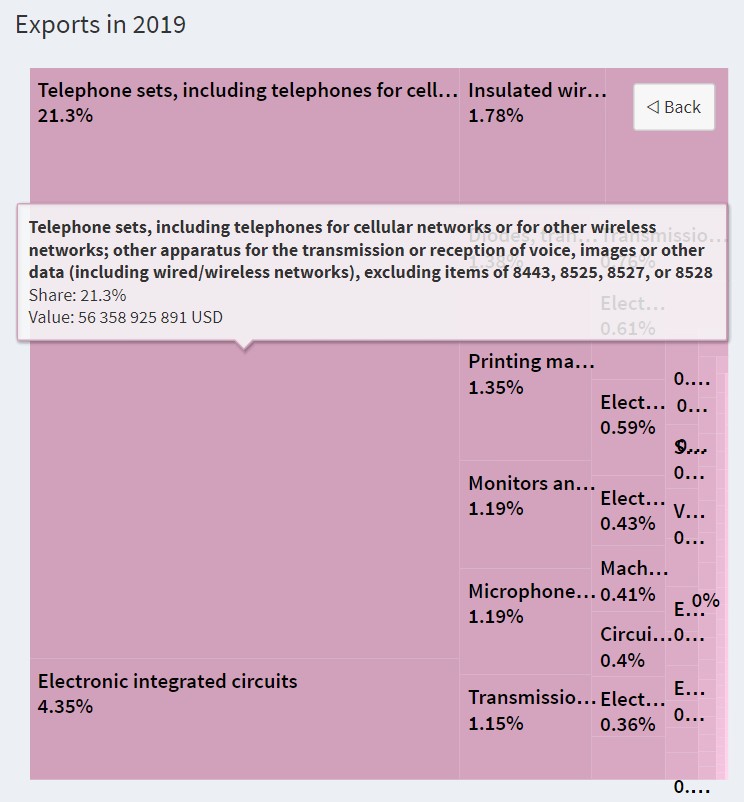
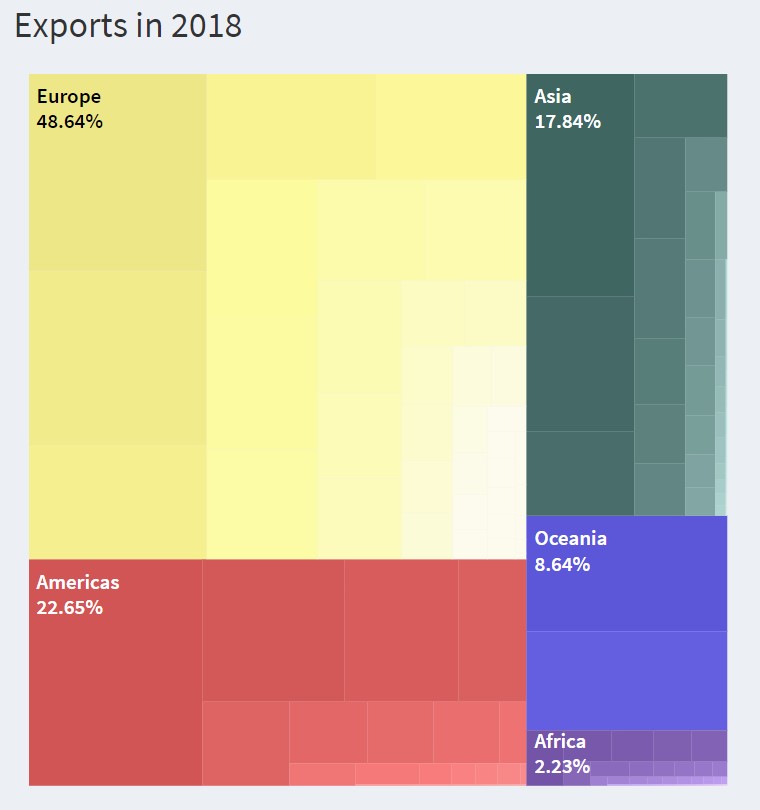
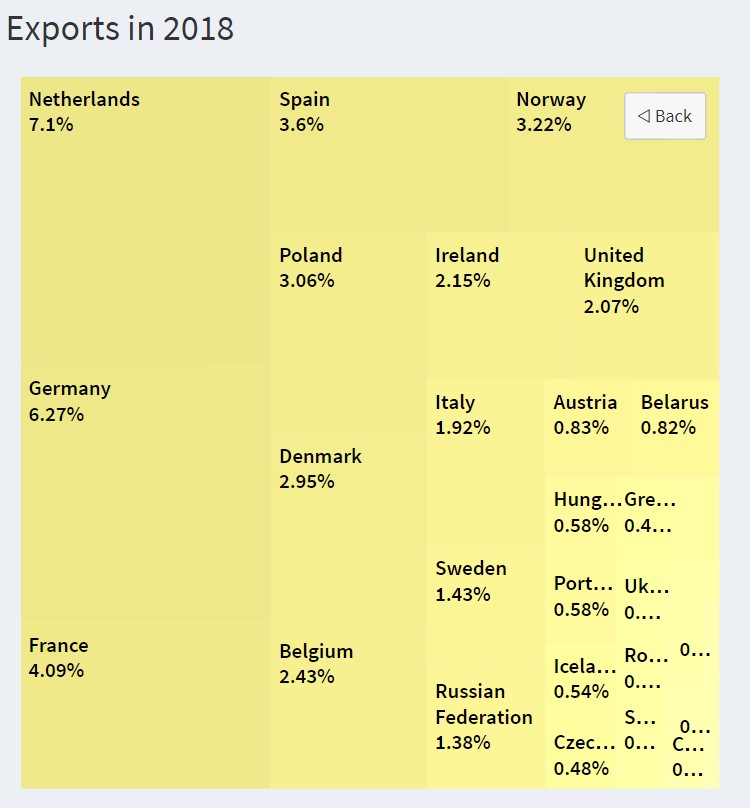
Step 4: Read the result. You can hover or click on the charts to see more detailed information.
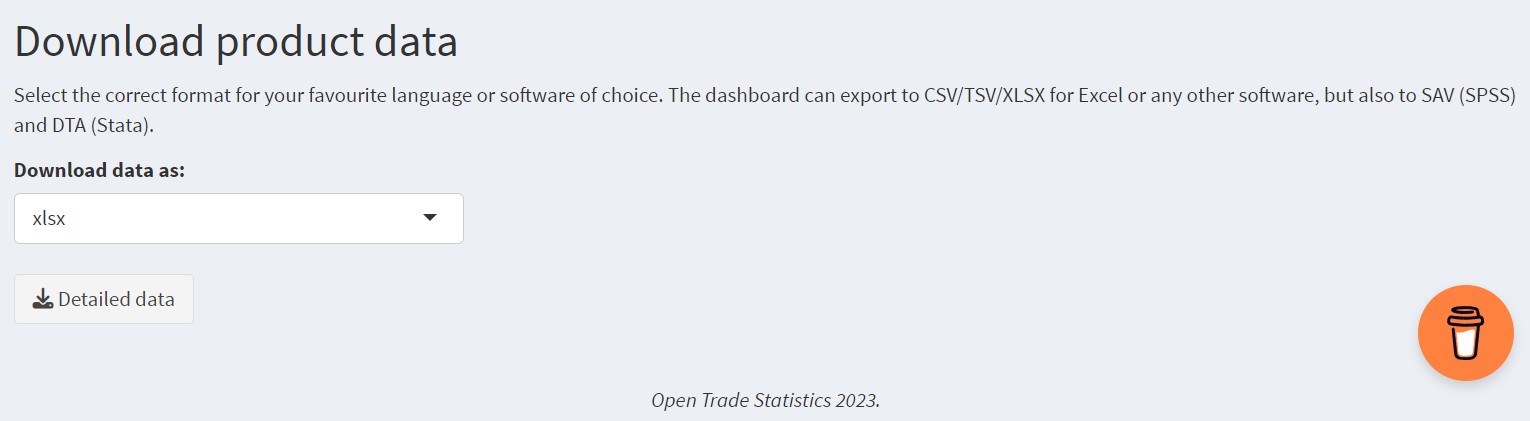
It is possible to download data (in csv, tsv, xlsx, sav, dta format) detailing the trade situation of the product group year over year between countries around the world.
Source: Center for WTO and International Trade - VCCI